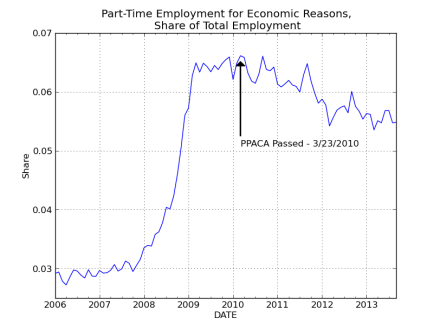
I successfully made my first annotated graph of something using pandas, datetime, matplotlib, and some other libraries and pulling data from FRED without ever looking at it. It’s pretty exciting. Here’s the graph (click to enlarge):
I’m not really contributing very much to this argument (Dean Baker, Matias Vernengo, and Media Matters are already all over this), but the last hour spent playing with matplotlib.pyplot.annotate had to produce something.
In other news, Quantitative Economics Using Python (Stachurski and Sargent) is a blast and the most fun I’ve had learning at least since May.

